Legende im Plot
Wenn wir uns diesen Plot hier anschauen:
x <- 1:10
plot(x,
     x^2,
     type="l",
     lwd=3)

lines(x,
      x^3,
      col="gray",
      lwd=3)

lines(x,
      x,
      col="red",
      lwd=3)
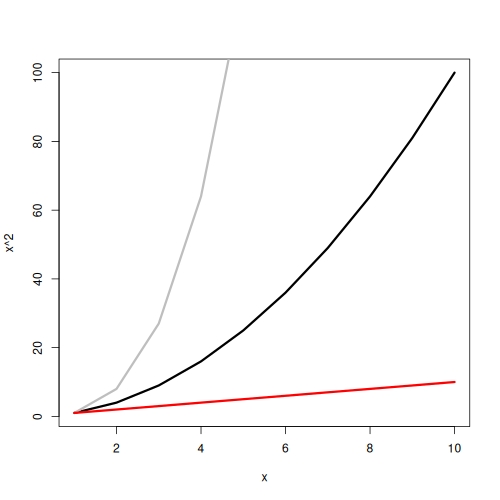
Dann kann man vielleicht ein Problem erkennen, oder? Man kann nicht wirklich nachvollziehen welche Linie was ist. Wir brauchen eine Legende!
legend()
x <- 1:10
plot(x,
     x^2,
     type="l",
     lwd=3)

lines(x,
      x^3,
      col="gray",
      lwd=3)

lines(x,
      x,
      col="red",
      lwd=3)
